
This study has not yet been peer reviewed.
A novel SARS-CoV-2 variant, VOC 202012/01, emerged in southeast England in November 2020 and appears to be rapidly spreading towards fixation. We fitted a two-strain mathematical model of SARS-CoV-2 transmission to observed COVID-19 hospital admissions, hospital and ICU bed occupancy, and deaths; SARS-CoV-2 PCR prevalence and seroprevalence; and the relative frequency of VOC 202012/01 in the three most heavily affected NHS England regions (South East, East of England, and London). We estimate that VOC 202012/01 is 56% more transmissible (95% credible interval across three regions 50-74%) than preexisting variants of SARS-CoV-2. We were unable to find clear evidence that VOC 202012/01 results in greater or lesser severity of disease than preexisting variants. Nevertheless, the increase in transmissibility is likely to lead to a large increase in incidence, with COVID-19 hospitalisations and deaths projected to reach higher levels in 2021 than were observed in 2020, even if regional tiered restrictions implemented before 19 December are maintained. Our estimates suggest that control measures of a similar stringency to the national lockdown implemented in England in November 2020 are unlikely to reduce the effective reproduction number Rt to less than 1, unless primary schools, secondary schools, and universities are also closed. We project that large resurgences of the virus are likely to occur following easing of control measures. It may be necessary to greatly accelerate vaccine roll-out to have an appreciable impact in suppressing the resulting disease burden.
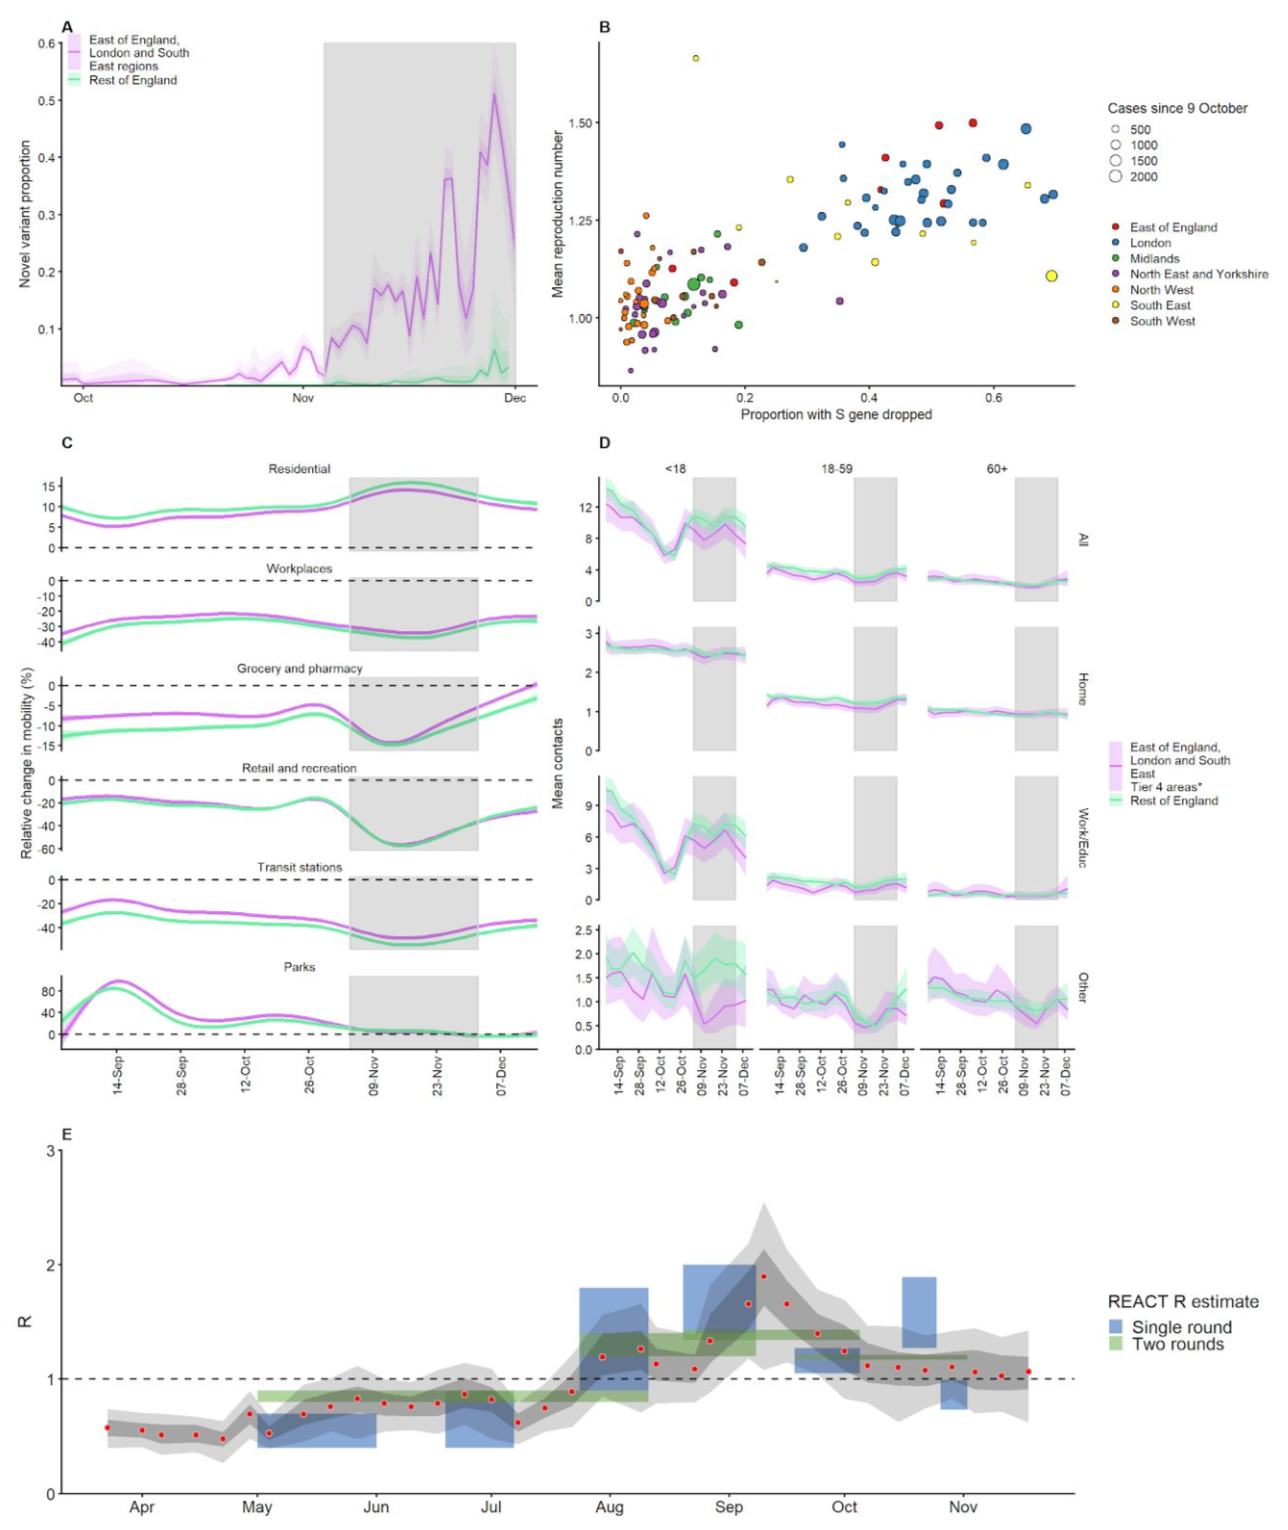
Fig. 1. (A) Proportion of VOC 202012/01 in South East, East of England, and London NHS England regions versus the rest of England from 28 September – 1 December 2020 (mean and 95% CI). Grey shaded areas (panels A, C, D) reflect the period of time when England was in a second national lockdown. We cut off the data after 1 December 2020 due to a substantial decrease in representativeness after this time (Fig. S4). (B) Proportion of S gene drop-outs (5 – 11 December) versus mean reproduction number (27 November – 4 December) by local authority in England. The one-week lag accounts for delays from infection to test. (C) Percentage change (95% CI) in Google Mobility indices relative to baseline over time and (D) setting-specific mean contacts (95% CI) from the CoMix study (9) over time and by age for local authorities that went into Tier 4 compared to the rest of England. Educ = education setting. Some local authorities that were within the South East, East of England, and London NHS England regions did not go into Tier 4 and were therefore included in the rest of England for panels C and D. (E) Estimates of R0 (50% and 95% CI) from CoMix social contact survey compared to Rt estimates from REACT-1 SARS-CoV-2 prevalence survey for England. R estimates based on single and aggregated REACT-1 survey rounds are shown.